Abstract
At approximately 2:46 AM on November 22, 2006, the largest explosion in the history of Massachusetts occurred in Danvers in an ink and paint manufacturing facility. The explosion was caused by an accumulation of gas or vapors within the facility that was subsequently ignited.
The blast completely destroyed the 1,400 m2 (15,000 ft2) facility and caused significant damage to the surrounding property and structures. Broken windows were observed up to 1.6 km (one mile) from the facility. In addition, residences immediately to the north and commercial structures to the west were severely damaged by the blast. The ensuing fire burned in the facility for hours after the explosion.
Some key observations regarding the near-field blast damage include:
- the walls of a production room were observed to have been blown outward during the explosion and must have been due to a significant overpressure early in the explosion,
- directional damage within the facility that included lifted and bent mezzanine grating, and
- damage to the neighboring structures outside the facility.
Using the advanced dispersion and explosion CFD software FLACS, it was possible to investigate the chain of events leading to the explosion. This included evaluating potential ignition sources within the facility and the corresponding explosion itself, by comparing the simulated overpressures of the exploding fuel-air cloud with the near-field blast damage within and outside the facility.
Simulations demonstrated that the Danvers explosion was far from trivial to understand and that the resulting blast-damage was very dependent on the details of the exploding fuel-air mixture. This study showed how only certain ignition locations within the facility storage room were capable of reconciling the observed near-field blast damage, and hence the origin of the explosion was identified. The study further demonstrates how advanced CFD tools such as FLACS provide invaluable analyses for explosion investigations.
Introduction
At approximately 2:46 AM on November 22, 2006, an explosion devastated a facility in the Danversport area of Danvers, MA. The facility was a shared space between Coatings, Adhesives, and Inks (CAI) and Arnel Company, Inc. (Arnel). The explosion and ensuing fire completely destroyed the facility, and the blast wave from the explosion caused damage to windows as far away as 1.6 km (one mile) as well as substantial damage to the surrounding buildings. Approximately a dozen people suffered minor injuries as a result of the blast, and there were no fatalities reported.
CAI manufactured solvent-based inks and used an assortment of solvents (alcohols, aliphatic hydrocarbons, glycols, and esters), pigments, and resins in the facility. Arnel’s portion of the plant was equipped to produce solvent- and water-based paints and coatings, and therefore contained various solvents (alcohols, ketones, aromatic hydrocarbons, and esters), pigments, and resins. Both CAI and Arnel kept solvents in three underground storage tanks (USTs), and both had industrial-grade nitrocellulose in trailers adjacent to the building.
This paper presents an advanced analysis into determining the “origin” of the explosion using the computational fluid dynamics (CFD) software FLACS. A brief description of the facility is first provided, followed by the sequence of events leading up to the explosion. Next, a summary of the inspection findings is provided. Finally, explosion analyses are conducted by igniting the flammable mixture within the facility at various locations and comparing the development of the exploding fuel-air mixture with the observed blast damage. A more detailed analysis regarding Gexcon’s investigation can be found in a previous publication (1).
Background
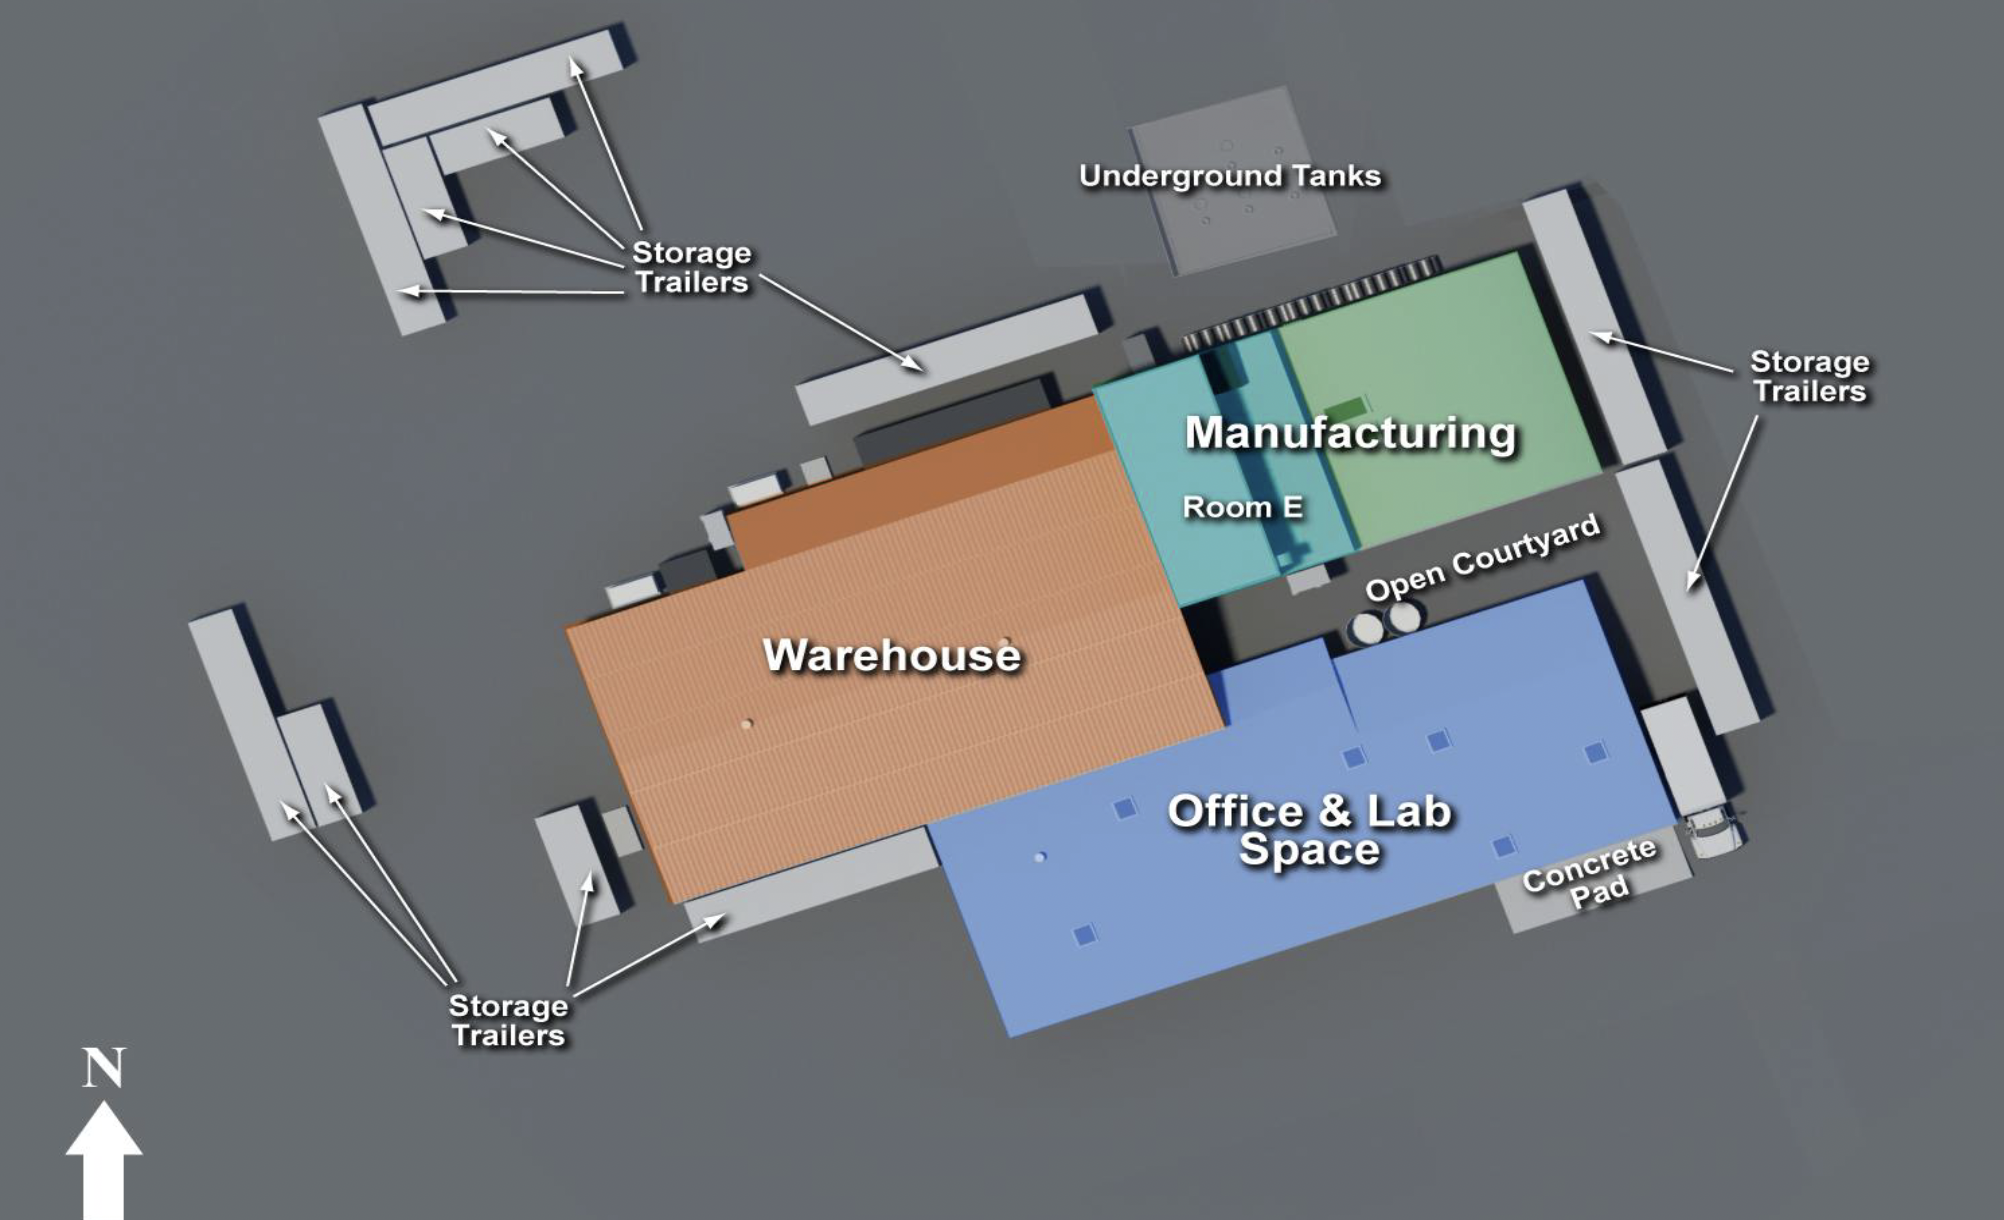
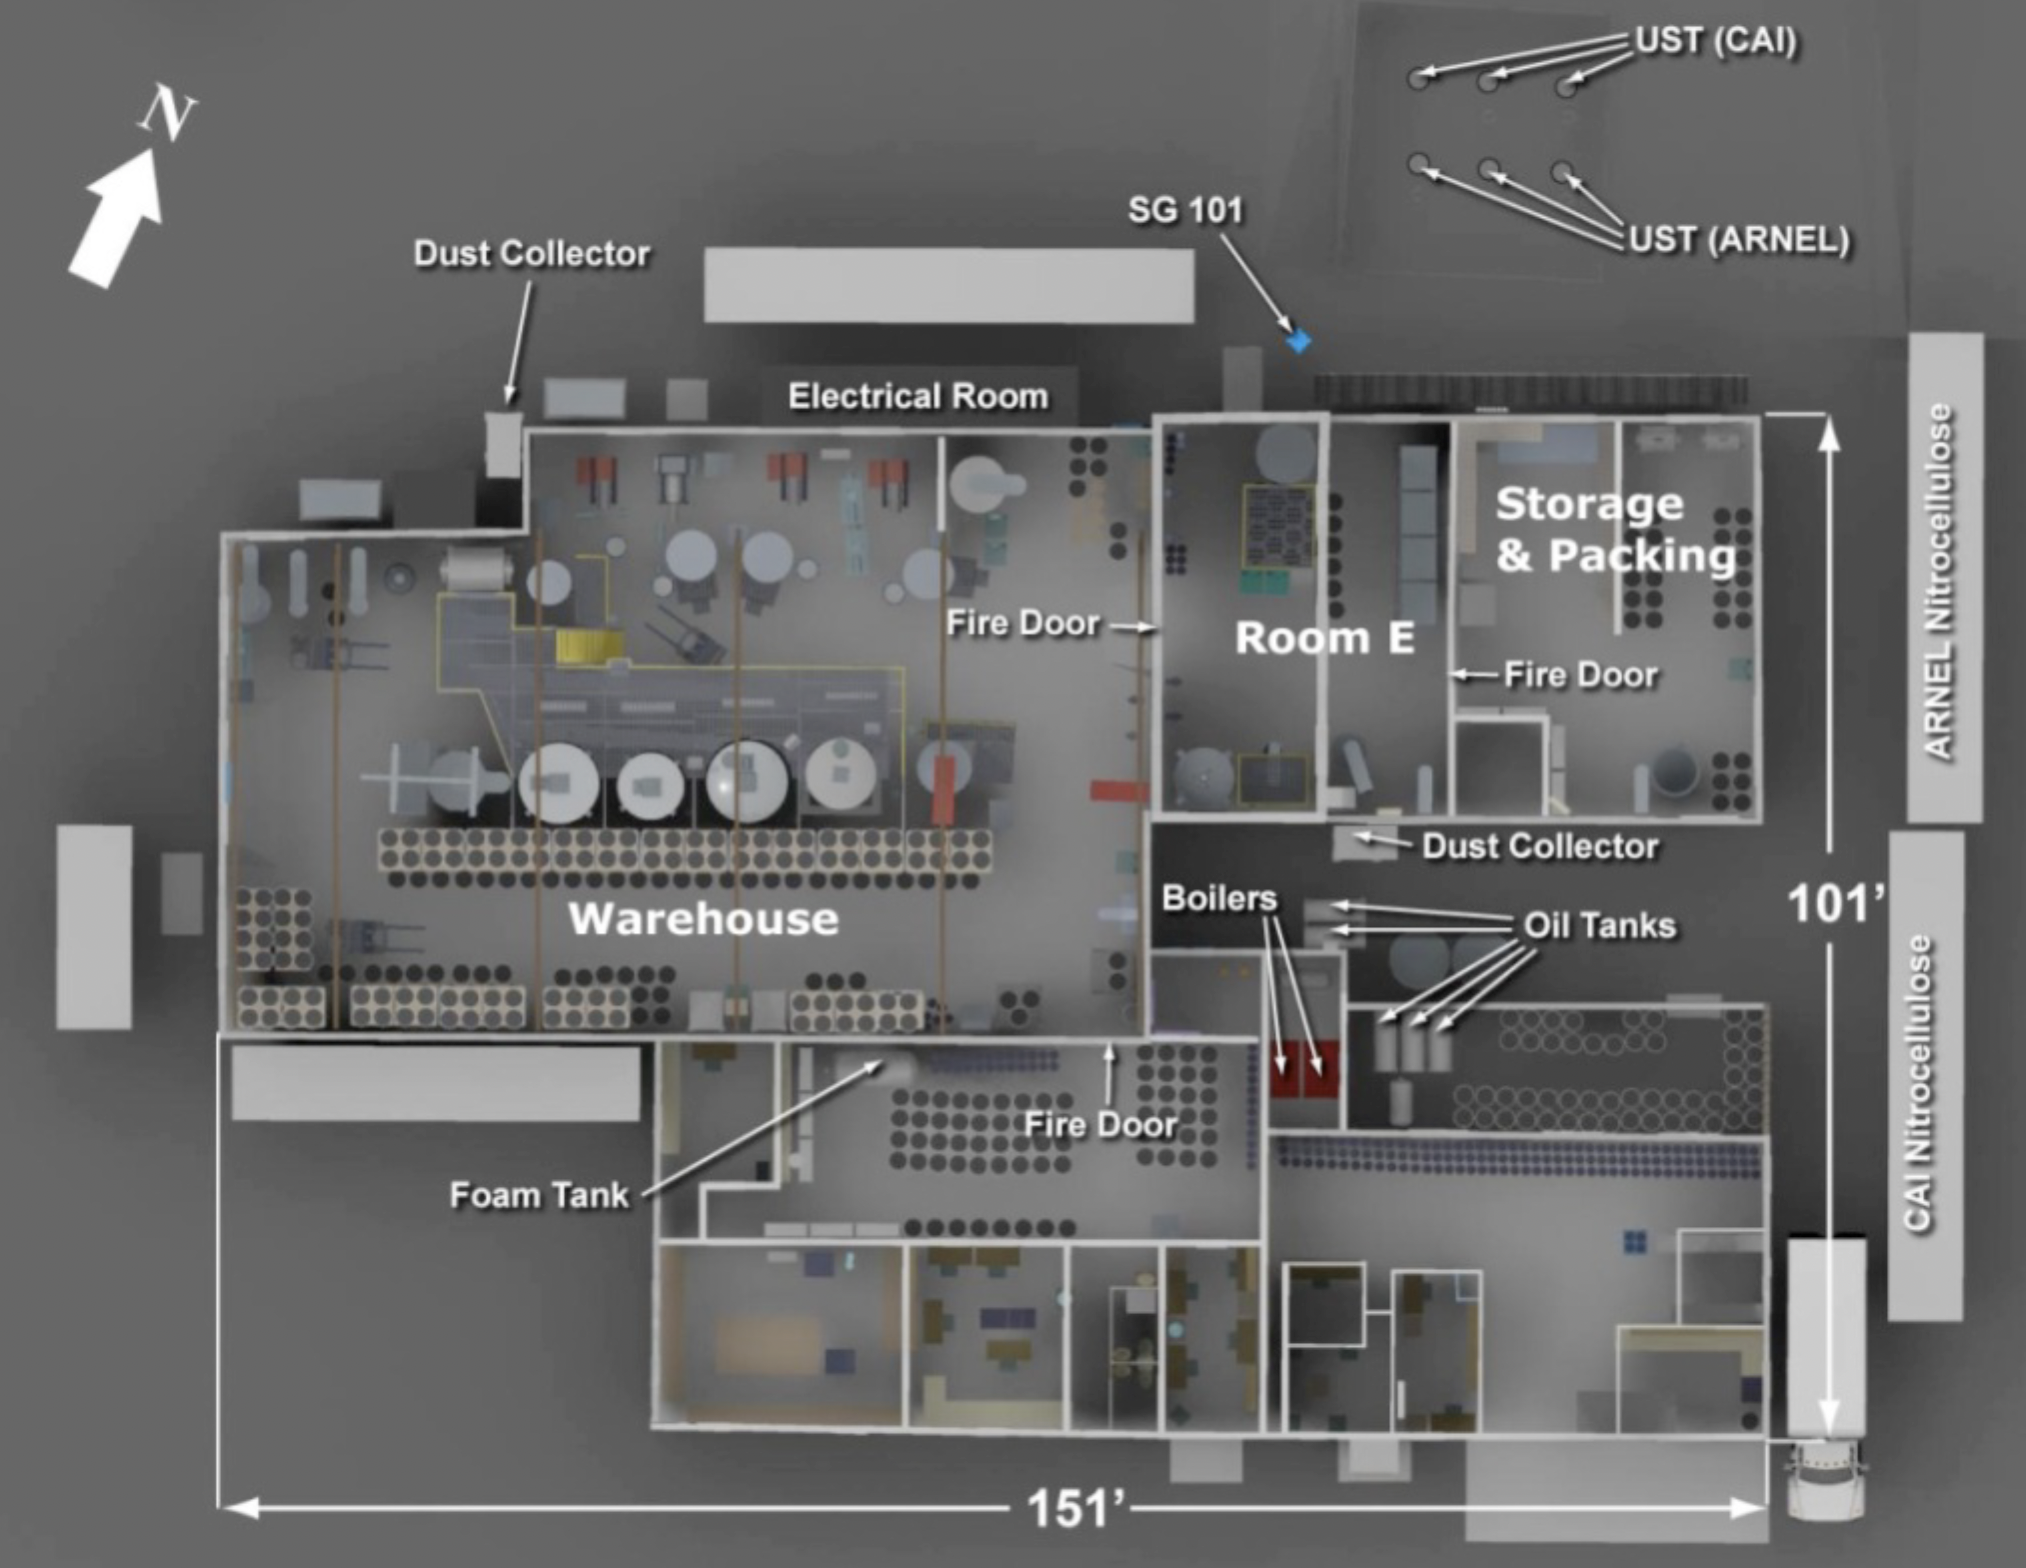
The layout of the facility is shown in Figure 1. The employee offices and lab facilities were on the south side of the plant. The warehouse and manufacturing areas were located on the west and north sides of the plant, respectively. The facility's interior and exterior walls were primarily constructed of unreinforced concrete masonry units (CMUs or ‘cinder blocks’). The manufacturing section was divided into two rooms: Room E and Arnel’s storage and packing area (shown in Figure 2). Figure 2 also shows the locations of the underground tanks where the solvents were stored and the trailers where the industrial-grade nitrocellulose was kept.
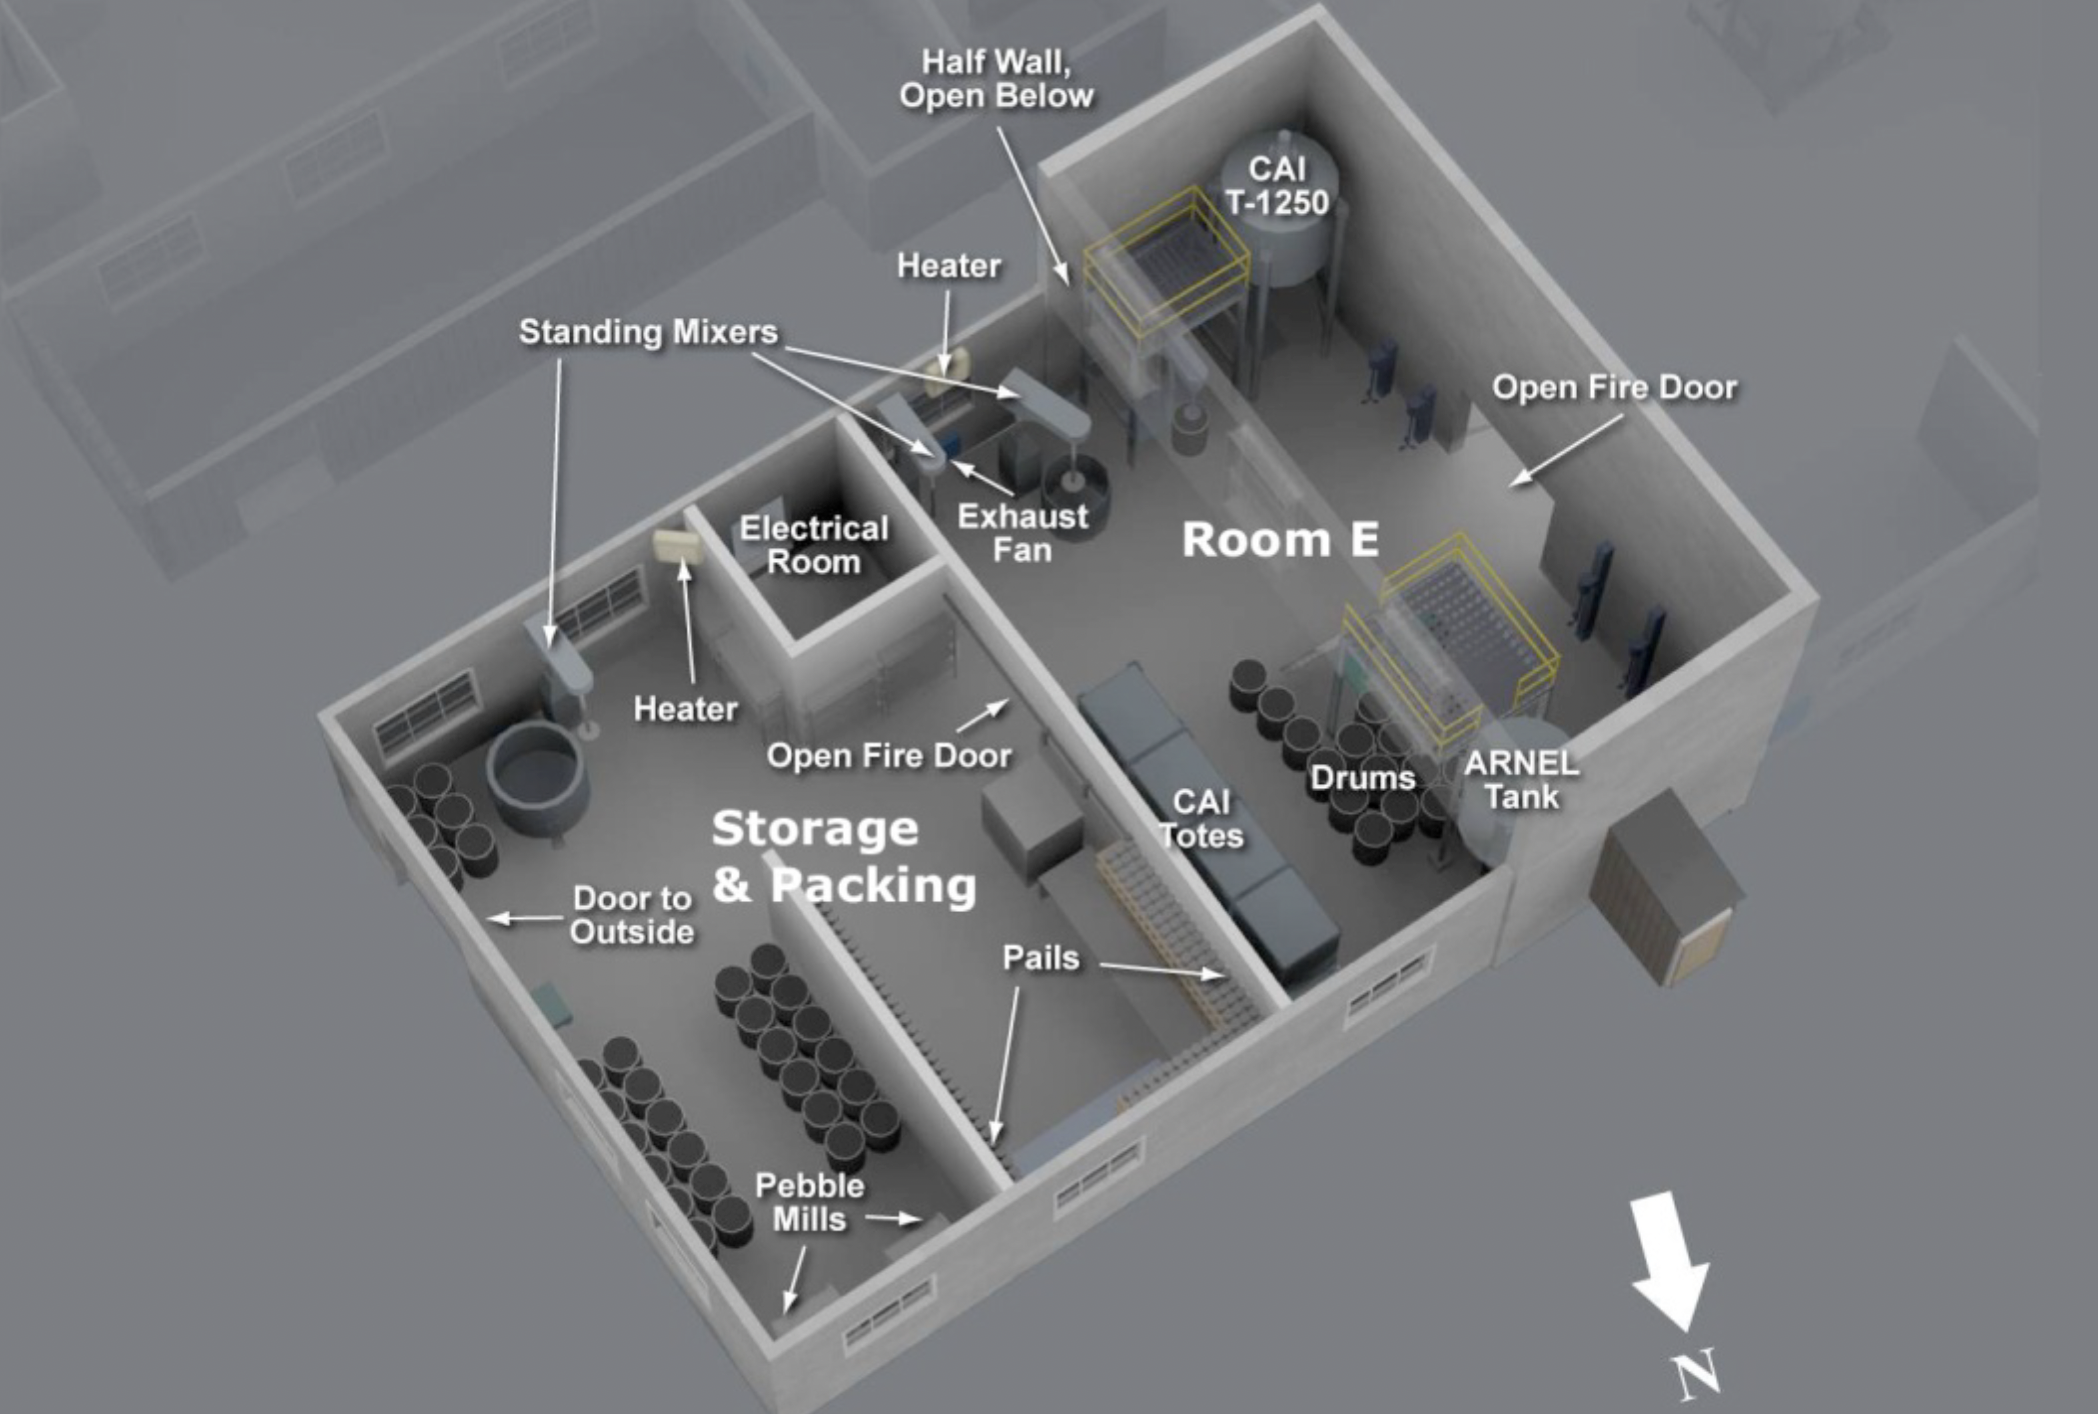
The manufacturing section of the facility contained Arnel’s storage and packing area and Room E as shown in Figure 3. There were two fire doors in Room E: one on the west wall leading to the warehouse section and one on the east wall leading to Arnel’s storage and packing area. Room E had a roof with two different ceiling heights and housed CAI’s T-1250 (V12) mixing tank, eight 1893-liter (500-gallon) totes used by CAI for solvent storage, and Arnel’s 3785-liter (1000-gallon) mixing tank. The USTs were piped directly into each company’s respective pump and distribution piping manifold. Arnel’s 3785-liter mixing tank did not have an explosion proof motor and the motor was located just outside the facility on the lower roof section east of the tank in a motor housing.
The warehouse section of the facility contained both CAI’s production area and Arnel’s storage area (shown in Figure 4). CAI had five closed-top, atmospheric pressure mixing tanks in the manufacturing section. The first mixing tank (V1) was not in use, while the other mixing tanks were used to manufacture ink vehicles. The remaining four mixing tanks from west to east were 03-6000 (V2), 03-1103 (V3), 01-1038 (V4) and 03-8600 (V5). Access to the top of the mixing tanks and controls was accomplished via a steel mezzanine. The mezzanine consisted of a 4.8 mm (3/16”) diamond plate welded to the top bar grating on the entire mezzanine.
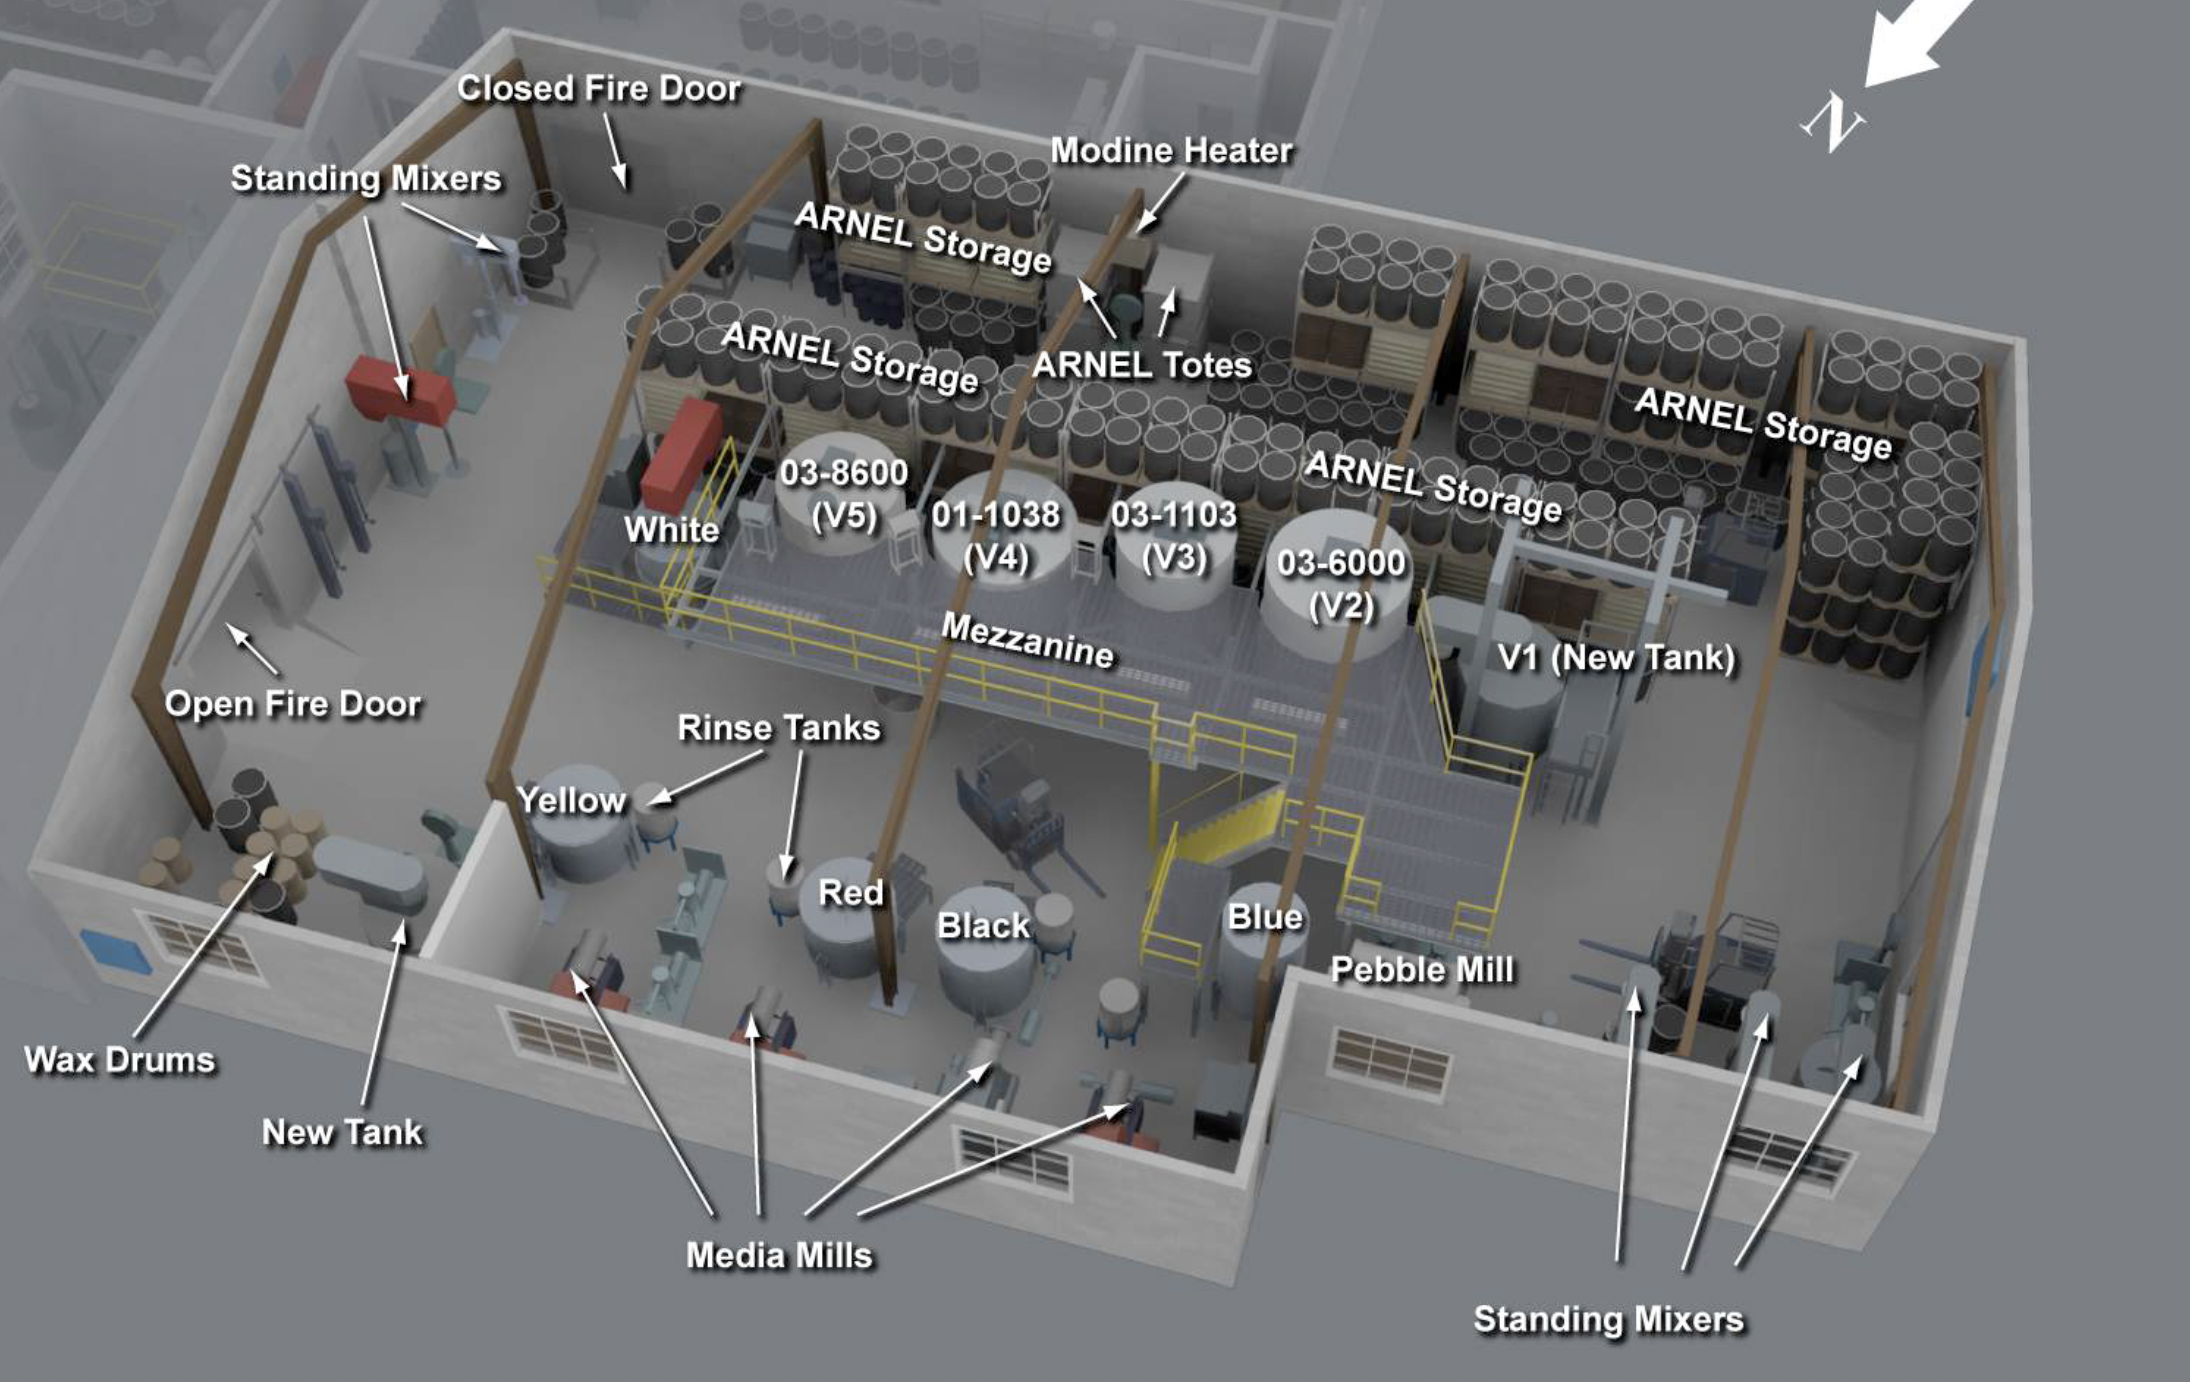
Arnel stored hundreds of 208-liter (55-gallon) drums and thousands of pounds of powdered raw material in the south area of the warehouse section of the facility. Arnel also stored solvents in four to six 1325-liter (350-gallon) portable totes stacked on the south wall.
Accident
At approximately 2:46 am, multiple witnesses reported that they were woken up by a loud explosion. Many witnesses also reported hearing a second, slightly less severe explosion within one minute after the initial blast. At the time of the incident, outside temperatures were between –3°C (27°F) and –2°C (29°F) and the wind was from the north at approximately 2.7 m/s (6 mph). Video footage from the Fox 25 News 5:00 am program showed significant burning in various areas of the facility. The contents of some tanks were shown burning, as well as various other areas of the plant. The blast destroyed the CAI/Arnel facility and caused significant damage to the surrounding property and structures.
Site inspection
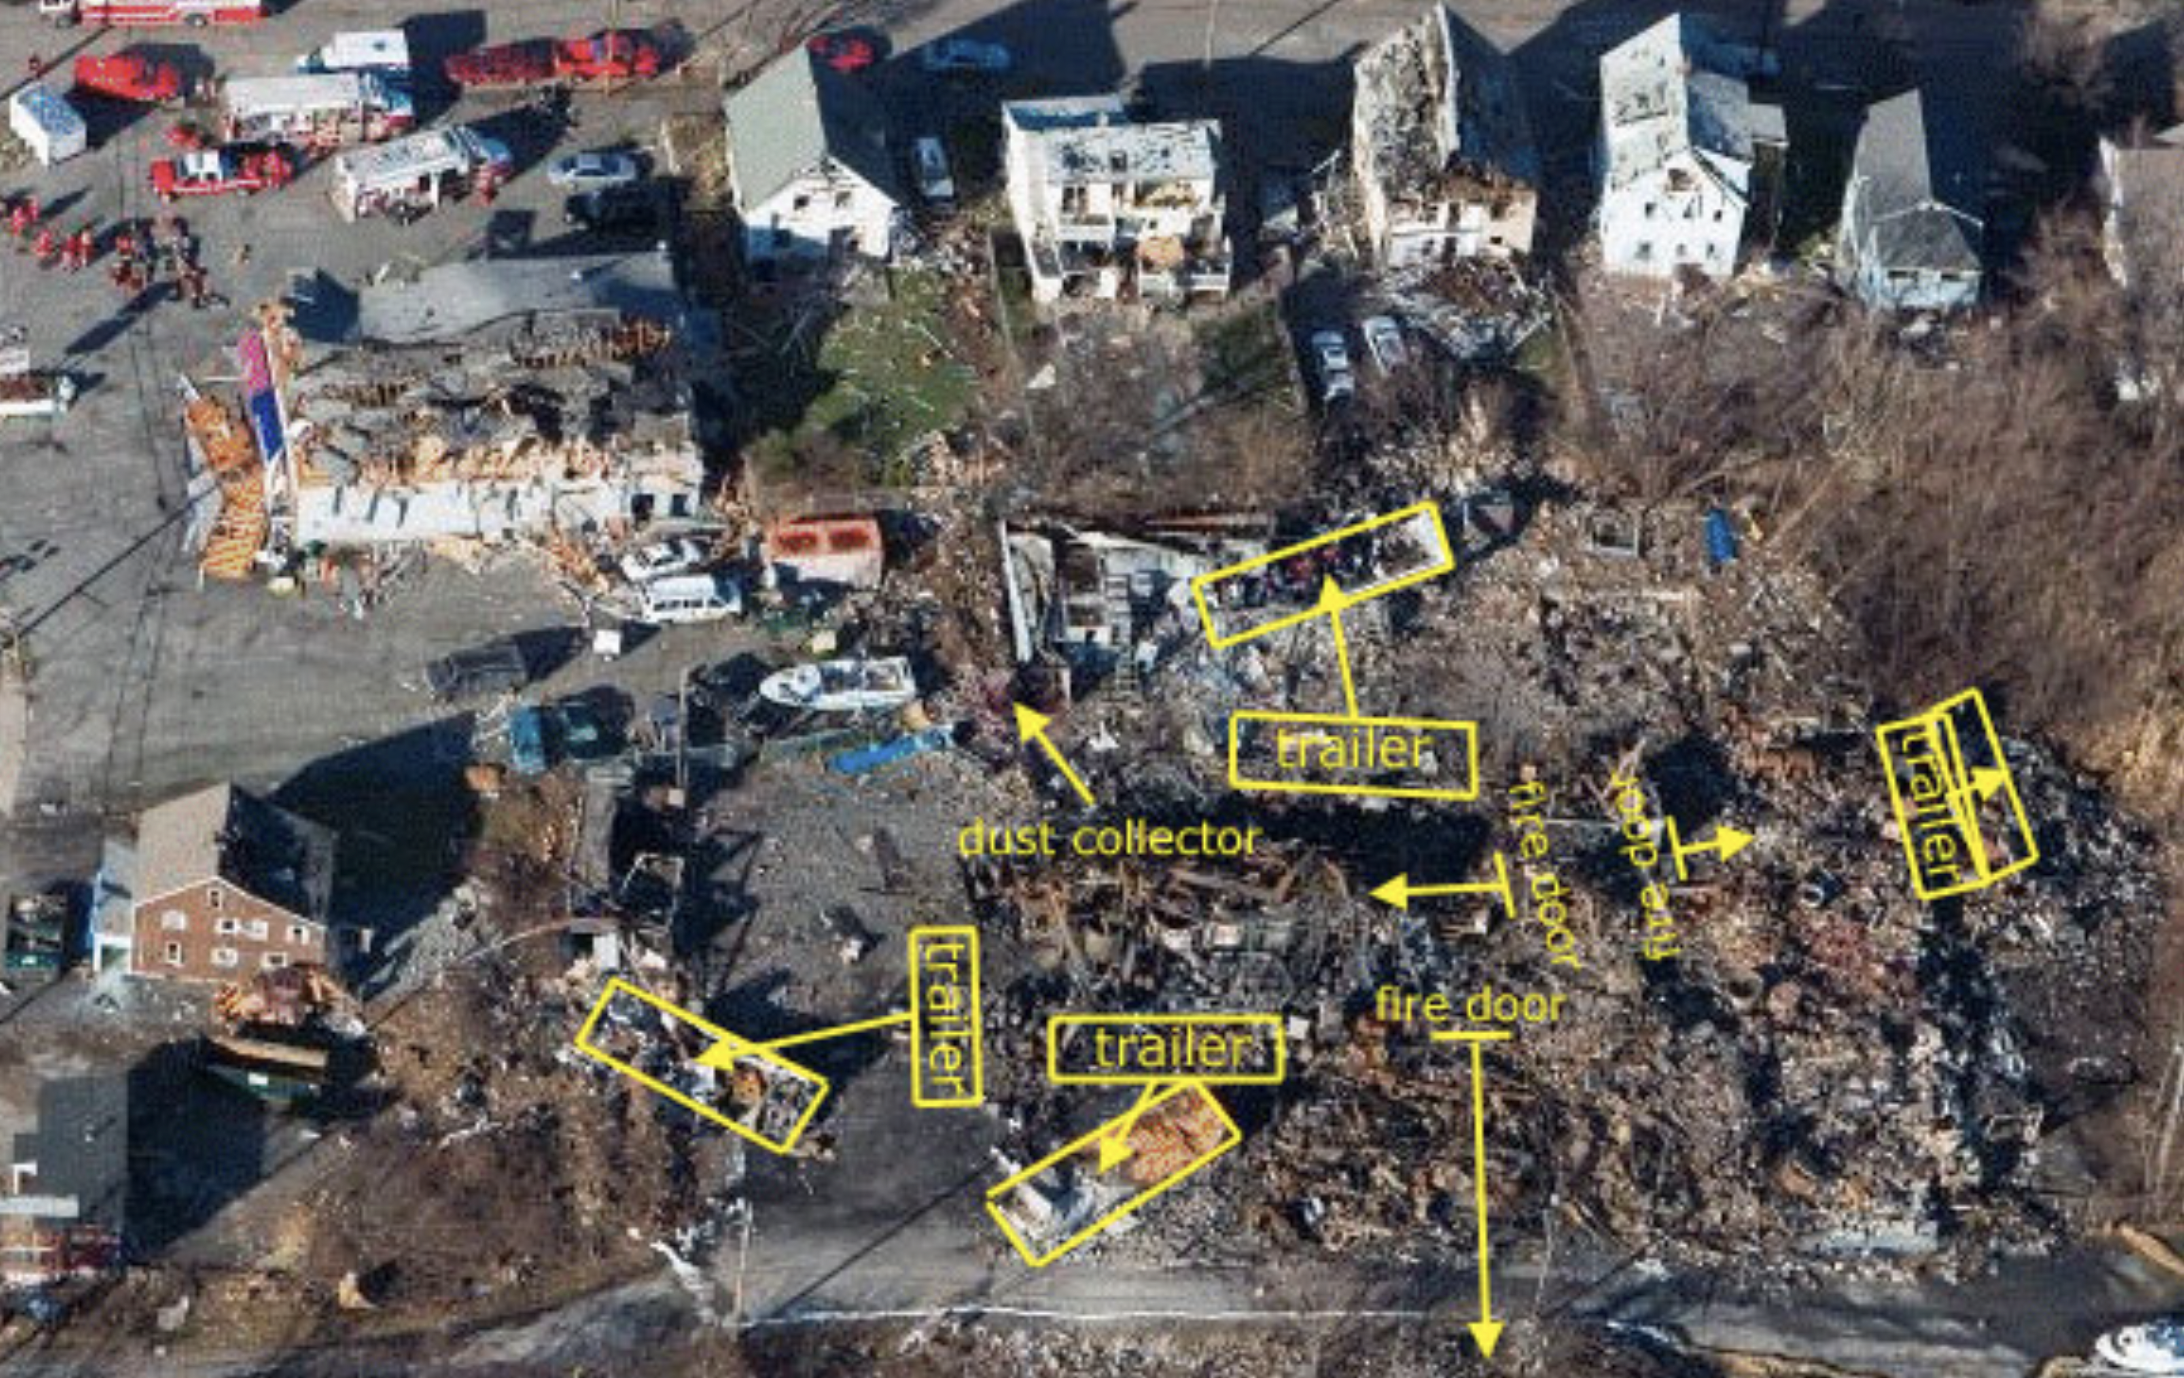
Figure 5 is an overhead image of the remains of the CAI/Arnel facility taken two days after the explosion. It is clear from the image that the facility was destroyed and many objects were blown further from the building. Significant damage was observed to the surrounding structures. A manhole cover, just north of the facility, was blown-off during the explosion and found 22.9 m (75 feet) from its original location. The nitrocellulose drums stored in the trailers all appeared to have burned as a result of the ensuing fire. Significant heat and fire damage was observed in the south section of the warehouse due to the storage of large quantities of raw materials in this area. In contrast, the northern wall had minimal heat and fire damage. The CAI mixing tanks were still standing and uncompromised after the blast. All four mixing tanks had significant thermal damage on the sides facing the Arnel storage racks due to the ensuing fire.
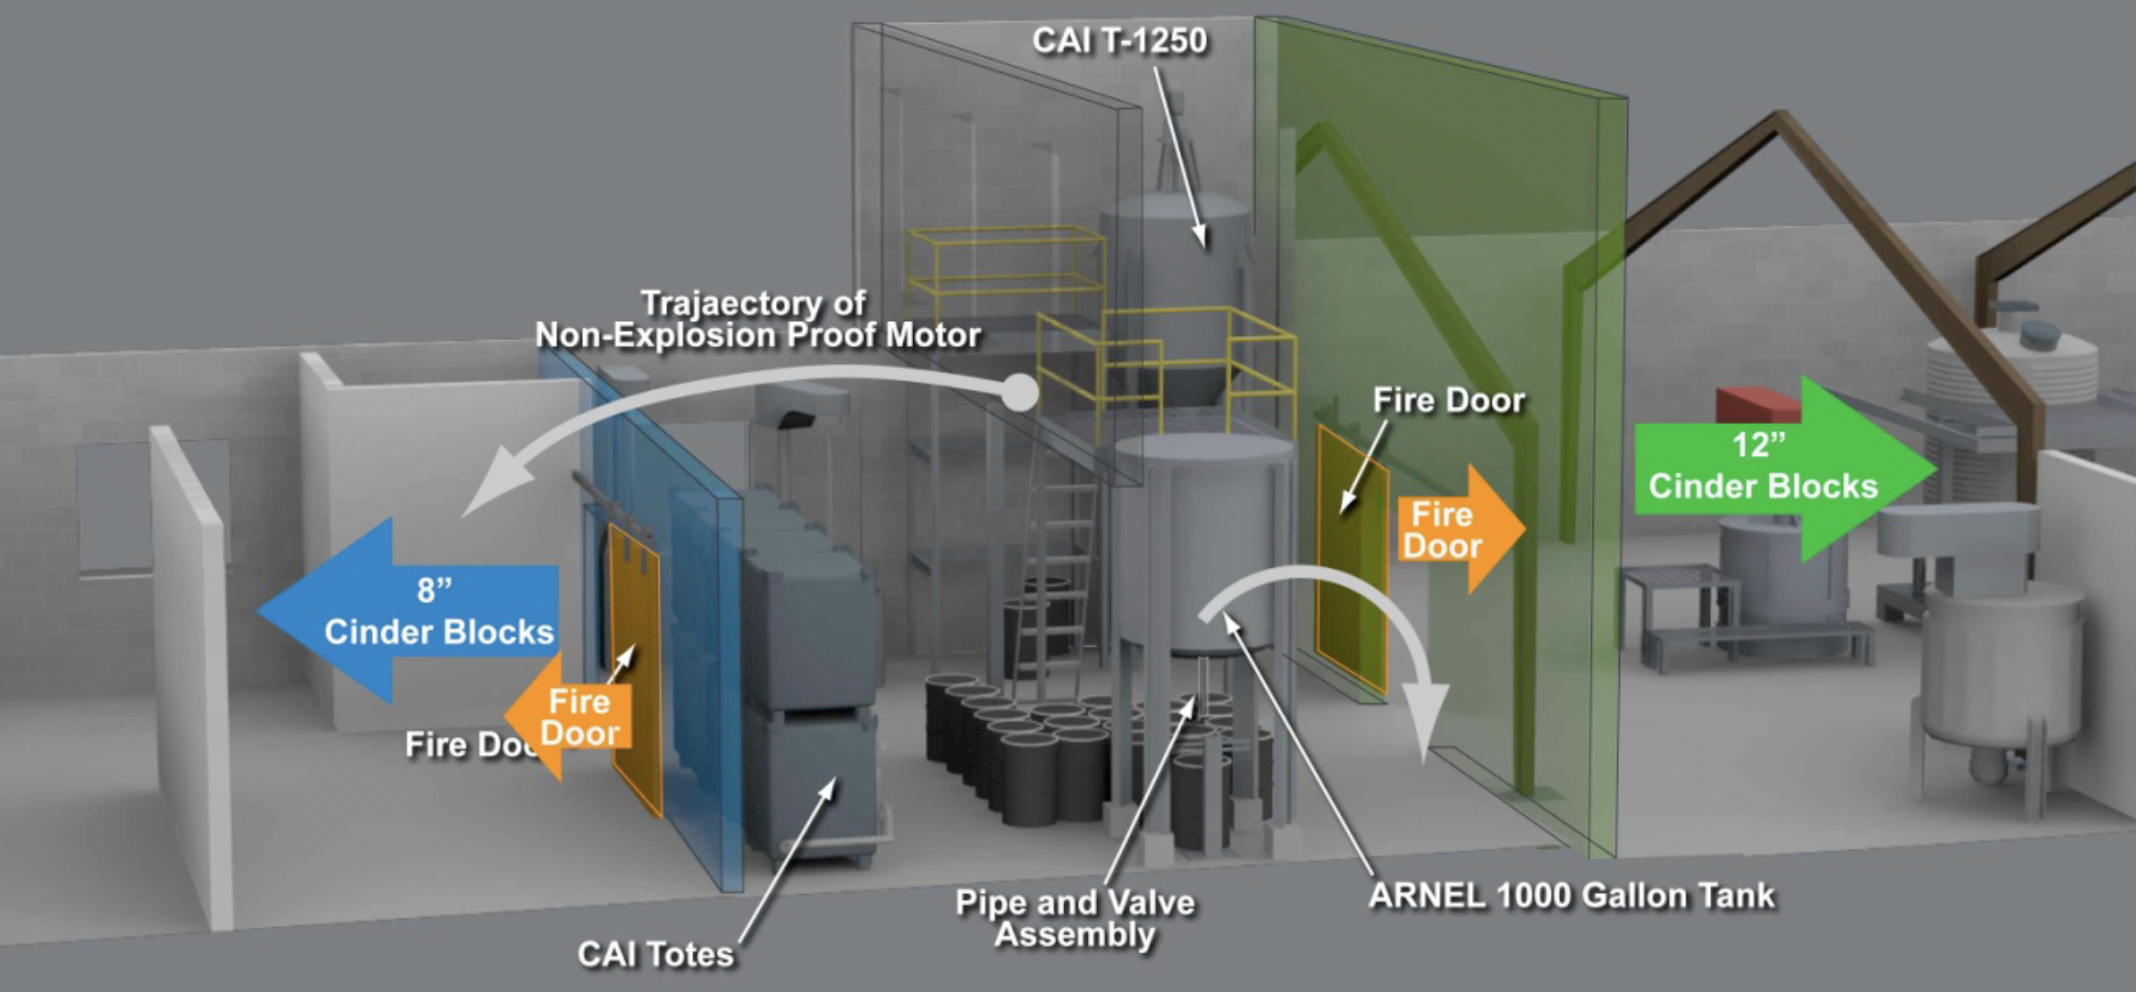
Despite the entire facility being destroyed and no walls standing, the inspection revealed that Room E within the facility had evidence of an internal overpressure event early in the explosion. Figure 6 shows a representative image of the original position and post blast movement of the major components that were in Room E as viewed from the north. CAI’s T-1250 and the eight 1893-liter (500-gallon) totes were still standing after the blast. The fire door to the west was found blown into the warehouse area 6.1 m (20 feet) away. The east fire door blew further east into the manufacturing area and was found 5.5 m (18 feet) away covered with 20.3-cm (8-inch) thick cinder blocks. The non-explosion proof motor was blown over the totes to the east (see Figure 6). Inspection of Room E further revealed that the cinder block walls (30.5-cm or 12-inch thick) supporting the high ceiling section were blown west into the manufacturing area, and the cinder block walls supporting the lower section ceiling (20.3-cm or 8-inches thick) were blown to the east. Inspection also revealed that there were practically no cinder blocks remaining in Room E after the explosion.
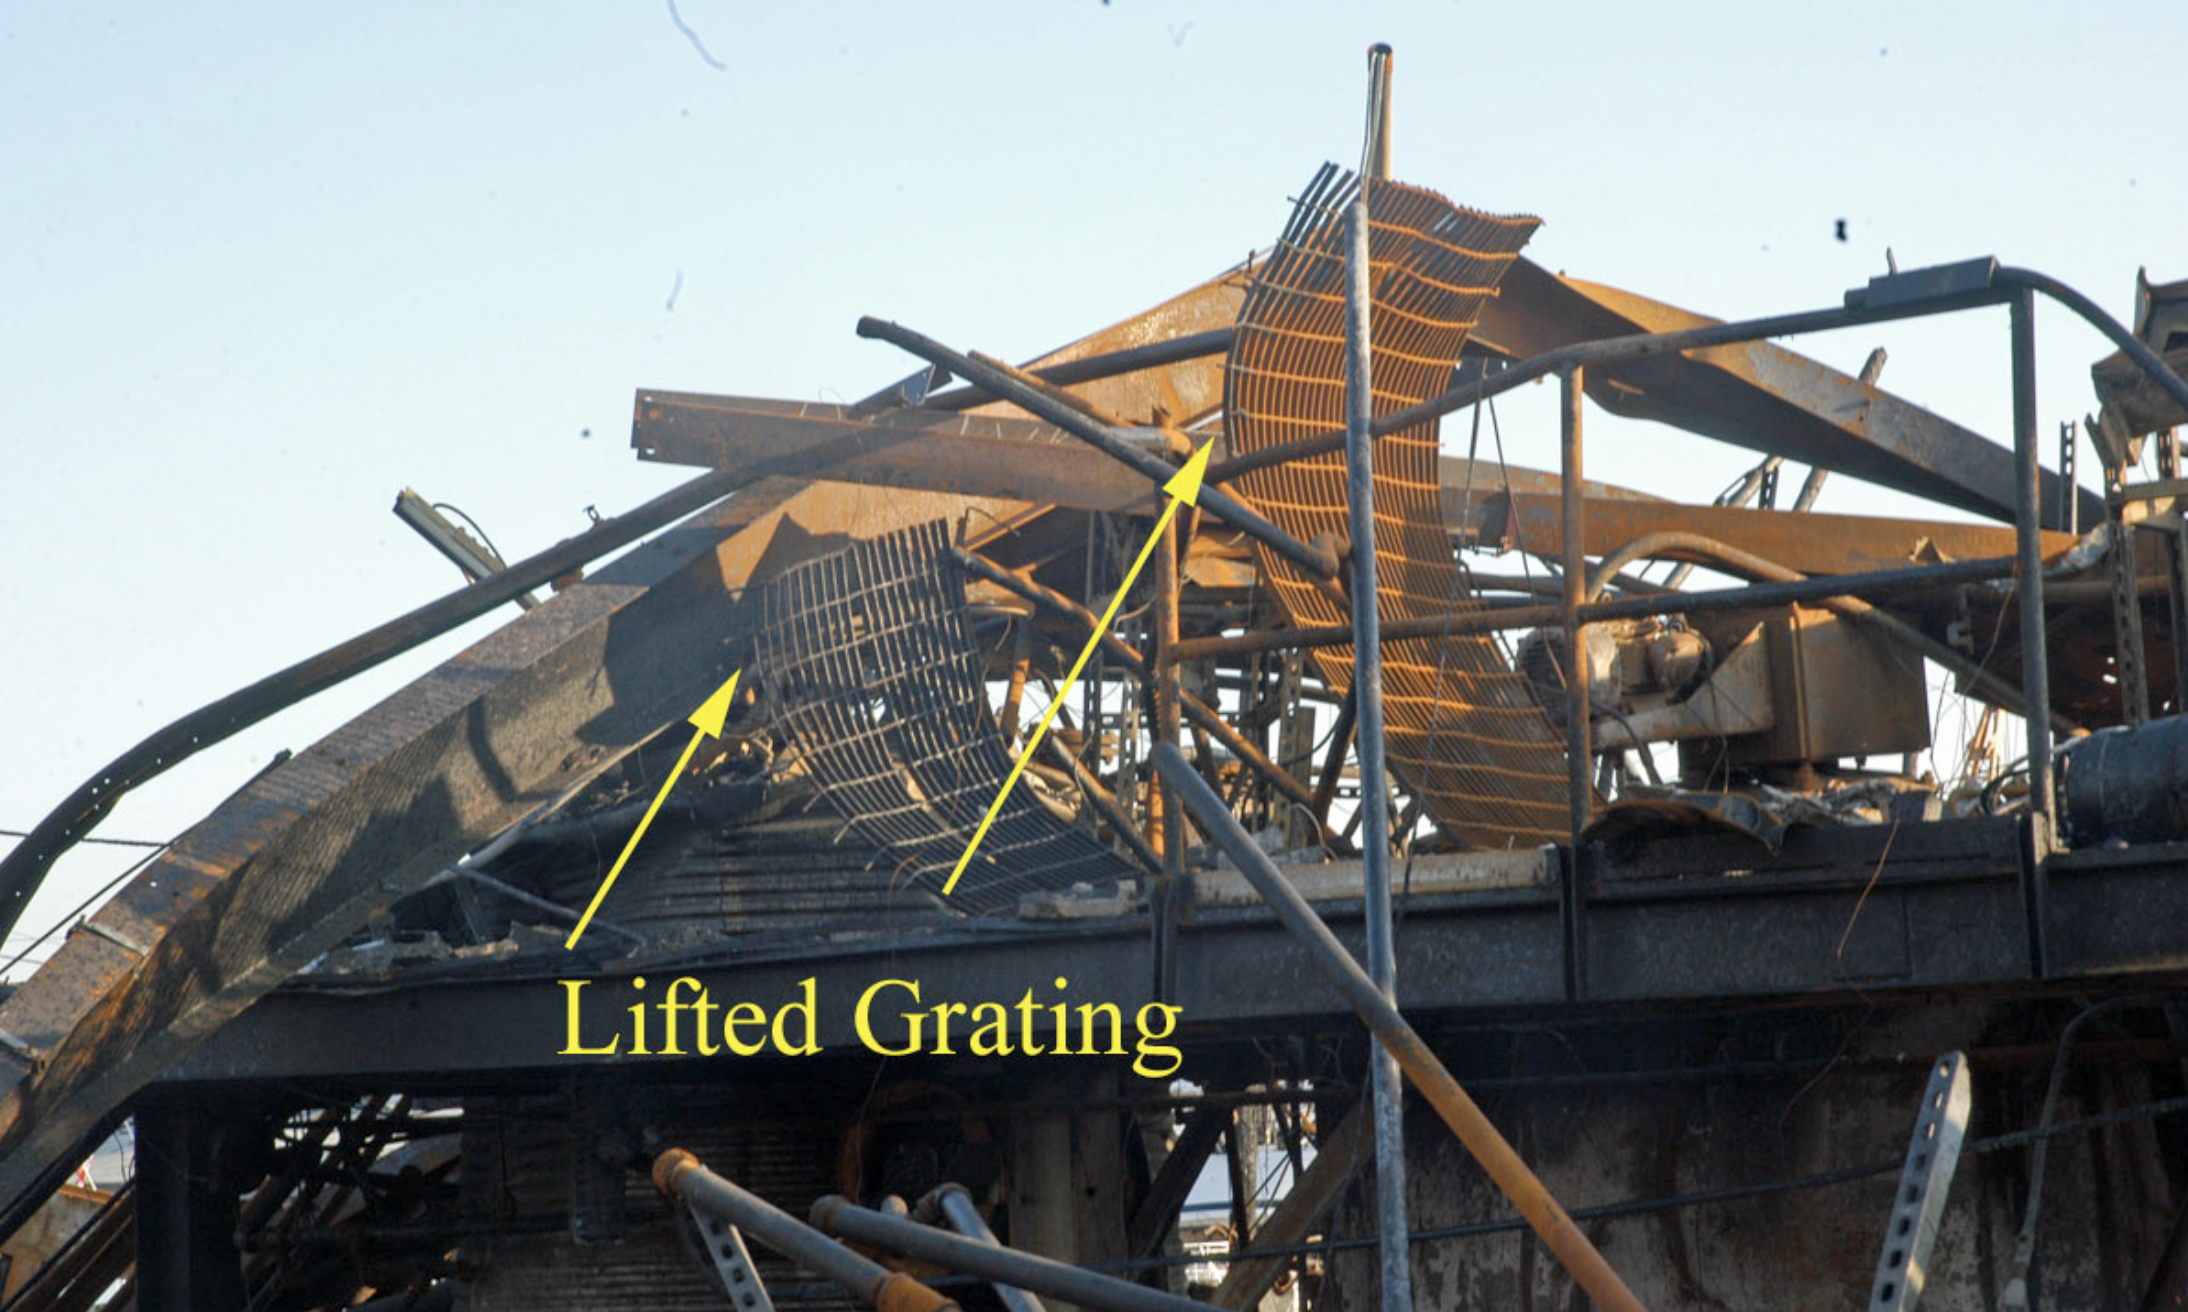
Just to the west of Room E, directional damage from east to the west (originating from the direction of Room E) was observed in the warehouse, and consisted of lifted and deformed grating on the mezzanine (Figure 7), displaced steel trusses, displaced railing and piping. The 4.8 mm (3/16”) diamond plating that was welded to the top of the bar grating was no longer present on the mezzanine structure and it was observed to be lifted and blown off the grating. This damage was likely due to pressure and drag effects associated with a blast wind originating from the direction of Room E.
Blast wave interaction with structures and the resulting damage is very complex to analyze and is dependent on many factors. Due to this complexity, the relationship between overpressures and resulting blast damage serves only as an approximation of the energy released in an explosion. From the energy released, one can further estimate the amount of fuel necessary to cause such an event. Residences and buildings immediately surrounding the facility were severely damaged by the explosion, suggesting a strong explosion (overpressures > 70 kPa or 10 psi) (2), (3) in the near field.
Analysis
Energy is released during a chemical explosion causing an overpressure and a blast (pressure) wave to propagate away from the source or epicenter of the explosion. After all the energy is released, this pressure wave decreases in strength as it propagates away from the epicenter. The resulting blast wave can cause damage to surrounding structures. Evaluating the damage caused by the blast wave allows one to approximate the energy released in an explosion, and hence the amount of fuel involved. Previous analyses1,4 determined that almost the entire facility needed to be filled with a flammable mixture near ideal or stoichiometric conditions. Furthermore, computational tools, which are capable of modeling flame propagation and resulting overpressures, can be used to evaluate the likely fuel-air mixtures as well as ignition source location by comparing the predicted and observed blast damage.
The CFD tool FLACS was used in the present study to model the explosion itself, and compare the predicted overpressures and dynamics of the burning fuel mixture with the observed structural response and blast damage within the facility. While the near-field blast damage can provide valuable information in determining the location of the ignition source and the dynamics of the intiating event, the far-field overpressure damage is less sensitive to the local dynamics of the explosion. Therefore, explosion simulations were conducted in order to reconcile the near- and far-field blast damage with the likely location of the ignition source. Some key observations regarding the blast damage include:
- Observed far-field blast damage estimates
- Walls of Room E blown outward by the explosion (Figure 6)
- Directional damage in the warehouse including the lifted and bent grating (Figure 7)
The first step in modeling the explosion is to construct a geometry model of the facility. Flame acceleration and pressure buildup within the facility are very sensitive to both confinement and congestion of obstacles within the facility (i.e., railing, support structures, various types of piping, hoses and ducts, small containers, etc.). An exact replica of the facility was not possible because it was completely destroyed by the blast, and there were only a limited number of photographs showing the interior of the building prior to the incident. Therefore, the goal of the present study was to create a moderately accurate geometry model, capturing the details of the major elements. Figure 8 shows the geometry model used for FLACS simulations. Based on photographs and a 3-D laser scan, the position of walls, doors and windows are modeled with reasonable accuracy. The congestion of objects within the model, which creates turbulence and flame accelerations, was significantly less than observed in the few available photographs within the facility taken prior to the incident. In order to evaluate the effect of the actual congestion within the facility, objects were added to the model at a given congestion density.
In order to determine the location of the ignition source and resulting building damage during the explosion, it is necessary to understand the dynamics of an explosion. FLACS was used to evaluate the ignition of a fuel-air cloud, the propagation and acceleration of the flame front around obstacles and congestion, and the resulting overpressures. Figure 9 shows an example of the flame and pressure development for an exploding stoichiometric fuel-air mixture, which was ignited in Arnel’s storage and packing area as viewed from the north. For this ignition, the flame accelerates away from the ignition source and vents out of the building and into Room E, causing a significant overpressure in Room E. The flame front then continues to the warehouse and significant overpressures are observed in this area of the facility. As the flame vents from the facility a blast wave is seen propagating away from the building.
Figure 10 shows an example of the calculated peak blast pressures measured at various locations within the facility and at the surrounding structures (residences and buildings). These peak blast pressures can be used to evaluate the likelihood of various explosion scenarios.
In order to understand the explosion dynamics, Gexcon modeled explosions for fuel-air clouds that filled the entire production area to just over stoichiometric conditions. More specifically, eight scenarios were simulated assuming different ignition locations shown in Figure 11. All ignition locations were chosen near the floor level to represent worst-case conditions, with locations #31-#34 within the warehouse, #21-#22 within Room E, and #11-#12 in Arnel’s storage and packing east of Room E. These simulations were performed with propane-air and methane-air mixtures using the assumed level of anticipated congestion within the facility. The explosion dynamics and far-field loads for methane were comparable to those for propane.
These explosion simulations provided interesting results regarding the dynamics of the explosion. One finding is that the blast waves emanating from the facility were somewhat directional and depended on the location of the ignition source (Figure 11 and Figure 12). It became immediately evident from the eight explosion scenarios that significant blast damage to the west (bakery) and north (houses) was the result of most scenarios except the two most western ignition locations (#31, #33).
The walls of Room E were observed to have been blown outward during the explosion and must have been due to a significant overpressure in Room E early in the explosion. In order to achieve significant overpressures in Room E, the 8 explosion scenarios revealed that:
- Ignitions outside of Room E resulted in strong flame accelerations venting into Room E, causing significant overpressures in Room E sufficient to blow out its walls. Hence, the ignition must occur within a limited distance from the doorway to Room E in order for the flame to reach Room E prior to any significant pressure buildup in the room of ignition (#11, #12, #32, #34).
- Some of the ignition locations modeled in the warehouse (#31, #33) resulted in significant overpressures in the warehouse before the flame enters Room E. This would blow the wall that separates the warehouse and Room E in the opposite direction as that observed after the explosion.
- Ideal stoichiometric mixtures ignited in Room E (#21, #22) resulted in moderately high overpressures 21-69 kPa (3-10 psi) in Room E. However, if the mixture deviated from ideal conditions, significant overpressures occurred outside of Room E prior to significant overpressures in Room E, causing the walls in Room E to fail inward.
Based on the above analyses, it appears that ignition locations well within the warehouse can be ruled out, whereas ignitions just inside the warehouse close to Room E (#32, #34) and in Arnel’s storage and packing (#11, #12) yield the highest overpressures in Room E. While ignition in Room E (#21, #22) cannot be ruled out, these scenarios appear less likely as near ideal conditions are required. As mentioned earlier, directional damage from east to the west was observed in the warehouse, and consisted of lifted and deformed grating on the mezzanine (Figure 7), displaced steel trusses, and displaced railing and piping. Diamond plating originally covered the mezzanine grating. This damage appears to be consistent with significant forces associated with a directional blast wind from east to west, as well as an initial pressure difference across the mezzanine (higher pressure from below), which had 4.8 mm (3/16”) diamond plates welded to the top of the bar grating. Sensor points were placed within the model to monitor the simulated dynamic pressure (½ρu2), or the forces associated with drag loads, and pressure both above and below the plating of the grated mezzanine for the six remaining scenarios.
The simulations suggest that the dynamic pressure (from east to west) for the ignition scenarios within the warehouse (#32, #34) were too low to be consistent with the observed damage (see Figure 13). Simulations also revealed that the dynamic pressure associated with ignition locations in Arnel’s storage and packing (#11, #12) resulted in larger dynamic pressures on the mezzanine grating in the location where they were lifted and bent towards the west (see Figure 13) as compared to ignitions within Room E (#21, #22). Furthermore, these dynamic pressures were accompanied by pressure differences of approximately 27.6 to 34.5 kPa (4 to 5 psi) across the mezzanine surface for ignition positions #11 and #12, which are consistent with the lifting of the grating. Lower pressure differences across the mezzanine were observed for ignition positions #21 and #22.
Conclusion
Considering the damage observed inside the facility, it would be intuitive to deduce that the explosion initiated in Room E. The directional analysis of the blast (shown in Figure 6) makes clear that the walls, fire doors, and associated equipment are all blown out from Room E.
Extensive simulations show that this, however, is unlikely, as the damage in other parts of the facility cannot be reconciled with an ignition inside Room E. While ignition in Room E cannot be entirely ruled out, these results for near stoichiometric gas clouds throughout the production area indicate that ignition in Arnel’s storage and packing area is the most likely cause.
Ignition locations in Arnel’s storage and packing were capable of reconciling the observed blast damage in the facility, including:
- significant overpressure in Room E causing the walls to blow outward,
- the blast venting into the warehouse causing the observed drag effects associated with a blast wind in this section of the buildings, and
- directional damage to surrounding structures outside the facility.
This suggests that this area of the facility likely contained equipment that was not rated for use in flammable environments and was a key finding in the investigation.
About the authors

Scott Davis, Ph.D., PE, CFEI
CEO – Principal Engineer @ Gexcon US
Dr. Scott Davis specialises in mechanical and aerospace engineering, and the engineering analysis and testing of combustion, thermal, and fluid processes. Dr. Davis applies his expertise to the investigation, prevention, and risk assessment of fires, explosions, and dispersion hazards such as flammable vapours and toxic exposures. Dr. Davis is a principal member of the NFPA 59A technical committee and provides key training in Gexcon’s advanced safety courses on major hazards, which includes LNG safety. Dr. Davis has published over 100 papers and is a regular speaker at process safety conferences.

Derek Engel, PE, CFEI
Managing Engineer @ Gexcon US
Derek specializes in mechanical, thermolfludic and fire protection engineering. He is responsible for fire and explosion related activities as well as safety studies for various industries. Using the world-leading FLACS software, he has conducted studies that include explosion risk analysis and toxic gas distribution. He also has experience using FLACS for cause and origin investigation for accidents in residences and various commercial operations including mining operations and dust/pulp processing facilities.
Derek also has experience in the testing and analysis of HVAC systems including experience in carbon monoxide production and dispersion through such systems.
Filippo Gavelli, Ph.D.
Consultant @ Blue Engineering and Consulting
Dr. Filippo Gavelli is a Consultant with Blue Engineering and Consulting, where he focuses on hazard analyses and risk assessments for LNG facilities. He has over 25 years of experience with CFD modelling, including vapour cloud dispersion, pool and jet fires, and vapour cloud explosions.
Dr. Gavelli was previously the Head of Dispersion Consulting at Gexcon US and was closely involved with the FLACS model validation effort for the U.S. Department of Transportation. He has been a member of the NFPA 59A committee for 15 years and has published several papers on the modelling of gas dispersion and vapour cloud explosions using FLACS.
Peter Hinze, Ph.D.
Dr. Peter Hinze specialises in the application of mechanical engineering principles to the analysis and investigation of automotive systems, industrial processes, fires, and explosions. He has investigated fires and explosions involving vehicles, industrial and manufacturing processes, and residential appliances. Dr. Hinze has particular experience investigating fires associated with automobiles, heavy equipment, motorcycles, and trucks, where common fire scenarios include post-collision fires, vehicles involved in fires in garages and other structures, and fires that occur while the vehicle is being operated. Dr. Hinze also applies the CFD software FLACS for consequence modeling.
Olav Roald Hansen
Founder @ HYEX Safety AS
Olav has a physics degree from NTNU and has worked with explosion modelling and FLACS since 1993. In the 1990s he was a FLACS developer with a particular focus on validation against experiments and made a FLACS training course. In the 2000s he was Gexcon R&D Director in charge of the FLACS development team and global sales until he started Gexcon US in 2008-2010.
Since 2012 Olav has worked as a consultant for GL (2012-2013) and LR (2014-2020). After starting HYEX Safety in June 2020 he has been working full-time with consulting work within hydrogen safety. Model validation and accuracy in CFD predictions have been a key focus in his work, and he is the author of numerous articles related to FLACS.
References
(1) Davis, S.G. and Hansen, O.R., New investigation findings on the 2006 Danvers, MA explosion, Journal of Loss Prevention in the Process Industries, Vol. 23(2), pp. 194-210, March 2010.
(2) Lees, F.P., Loss Prevention in the Process Industries (2nd Edition). Elsevier. (1996).
(3) Harris, R.J., The investigation and control of gas explosions in buildings and heating plant. British Gas Corporation. (1983).
(4) Davis, S.G. and Hansen, O.R., Lessons Learned from the 2006 Facility Explosion in Danvers, MA. Proceedings, 43rd Annual Loss Prevention Symposium, American Institute of Chemical Engineers Spring National Meeting, Tampa, FL (2009).